Glycaemic index: understanding it and choosing low-GI foods
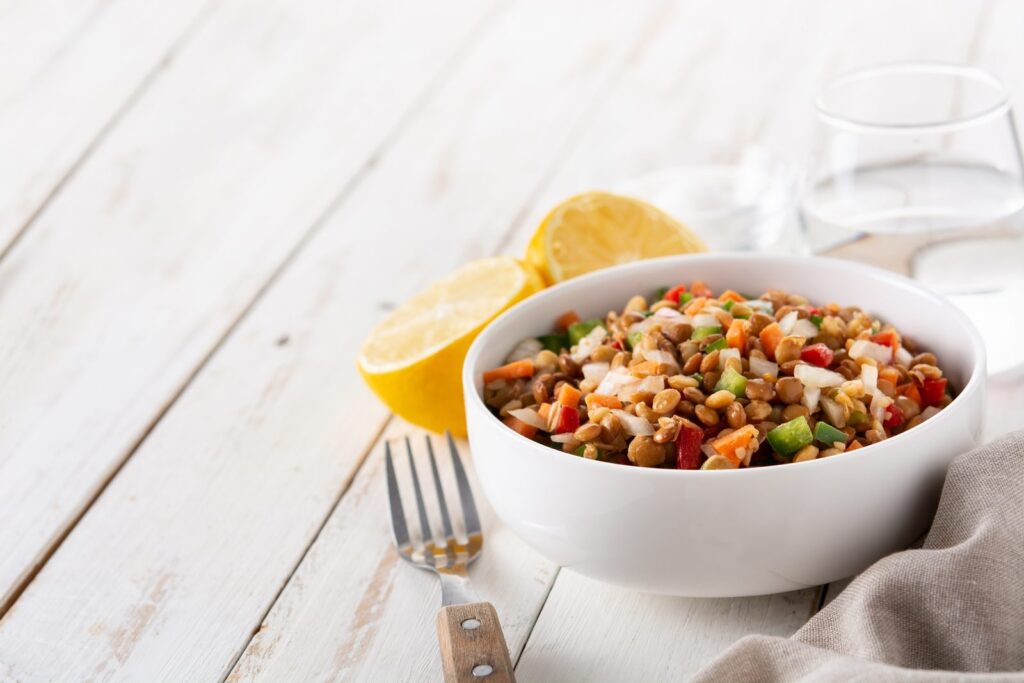
The glycaemic index (GI) ranks carbohydrate-containing foods according to how quickly and how far they raise your blood glucose, compared with pure glucose, which is set at 100. A GI is described as low at 55 or below and high at 70 or above. Pulses, most fruit, pasta and dairy products have a low GI; white bread, potatoes and white rice often have a high GI. But GI alone is not enough: you also need to look at the amount of carbohydrate you eat, which is the glycaemic load. Here are the published values, how to read them and how to lower the GI of your meals.
👉 Free tool: Calorie deficit – calculate it in 30 seconds, no sign-up needed.
How a glycaemic index is measured
The definition adopted in France by the French Food Safety Agency (Afssa, now Anses) in its 2004 report “Carbohydrates and health” is precise. Fasting volunteers are given a portion of food that supplies 50 g of carbohydrate. Their blood glucose is measured at regular intervals and the area under the curve above fasting glucose is calculated. This area is then compared with the one obtained in the same people with a reference food supplying the same amount of carbohydrate. The result is expressed as a percentage.
Two references coexist: glucose and white bread. The international tables by Atkinson et al. (Diabetes Care, 2008) recommend expressing results on the glucose scale and convert values using a factor of 100/70. All the values on this page are on the glucose scale.
The terms “slow sugars” and “fast sugars” are best forgotten. The French-speaking Diabetes Society (SFD) says so plainly in its 2016 report: they “should be completely abandoned”. Its example is telling: the baguette, long described as a slow sugar, has a glycaemic index close to that of glucose.
The table of glycaemic indexes of common foods
The values below come from the summary table of the 2008 international tables: they are averages drawn from several studies carried out by different laboratories. The margin (±) shows the variability between studies.
| Food | Average GI (glucose = 100) | Category |
|---|---|---|
| Soya beans | 16 ± 1 | Low |
| Kidney beans | 24 ± 4 | Low |
| Barley | 28 ± 2 | Low |
| Chickpeas | 28 ± 9 | Low |
| Lentils | 32 ± 5 | Low |
| Skimmed milk | 37 ± 4 | Low |
| Raw apple | 36 ± 2 | Low |
| Cooked carrots | 39 ± 4 | Low |
| Whole milk | 39 ± 3 | Low |
| Chocolate | 40 ± 3 | Low |
| Fruit yoghurt | 41 ± 2 | Low |
| Apple juice | 41 ± 2 | Low |
| Dates | 42 ± 4 | Low |
| Raw orange | 43 ± 3 | Low |
| Wholewheat spaghetti | 48 ± 5 | Low |
| White spaghetti | 49 ± 2 | Low |
| Orange juice | 50 ± 2 | Low |
| Raw banana | 51 ± 3 | Low |
| Raw mango | 51 ± 5 | Low |
| Porridge made with rolled oats | 55 ± 2 | Low |
| Muesli | 57 ± 2 | Medium |
| Raw pineapple | 59 ± 8 | Medium |
| Fizzy drink | 59 ± 3 | Medium |
| Honey | 61 ± 3 | Medium |
| Fries | 63 ± 5 | Medium |
| Cooked sweet potato | 63 ± 6 | Medium |
| Couscous | 65 ± 4 | Medium |
| Sucrose (white sugar) | 65 ± 4 | Medium |
| Cooked brown rice | 68 ± 4 | Medium |
| Cooked white rice | 73 ± 4 | High |
| Wholemeal bread | 74 ± 2 | High |
| White bread | 75 ± 2 | High |
| Watermelon | 76 ± 4 | High |
| Boiled potato | 78 ± 4 | High |
| Instant oat porridge | 79 ± 3 | High |
| Cornflakes | 81 ± 6 | High |
| Instant mashed potato | 87 ± 3 | High |
| Puffed rice cakes | 87 ± 2 | High |
| Glucose | 103 ± 3 | Reference |
A few lessons stand out from this table:
- Wholemeal bread does not have a lower GI than white bread (74 versus 75). Its advantage lies elsewhere: more fibre and minerals. The authors do point out, however, that there are low-GI breads, notably some grain breads (53 on average). Our guide which bread to choose goes through the options, including sourdough bread.
- Brown rice is only slightly below white rice (68 versus 73). The tables note that low-GI rice varieties exist.
- Processing matters enormously: porridge made with rolled oats is at 55, instant porridge at 79. A boiled potato is at 78, instant mash at 87.
- Pulses are the champions: lentils, chickpeas, kidney beans and soya sit between 16 and 32.
- A low GI does not mean “healthy”: chocolate is at 40. The authors point out that its high saturated fat content reduces its nutritional value, and that GI should never be used on its own.
The 2021 update of these tables (American Journal of Clinical Nutrition), which lists more than 4,000 foods, confirms the broad picture: dairy products, pulses, pasta and fruit generally have a low GI, while breads, breakfast cereals and rice exist in high, medium or low-GI versions. Most potatoes have a high GI, although low-GI varieties have been identified.
Glycaemic load: GI multiplied by the portion
GI compares equal amounts of carbohydrate (50 g), not real portions. Yet 50 g of carbohydrate is about 600 g of watermelon but less than 100 g of white bread, based on the Ciqual table values. Hence the value of the glycaemic load (GL), for which the SFD gives the formula:
GL = GI × amount of carbohydrate in the portion (in g) / 100
The SFD gives a striking example: a 30 g handful of peanuts provides 3 g of carbohydrate with a GI of 14, giving a load of 0.43, compared with 10.5 for 30 g of bread. The following table applies the formula to 100 g of ready-to-eat food.
| Food (100 g) | GI | Carbohydrate (Ciqual) | Glycaemic load per 100 g |
|---|---|---|---|
| Cooked carrots | 39 | 5.7 g | 2.2 |
| Cooked kidney beans | 24 | 12.3 g | 3.0 |
| Orange | 43 | 8.0 g | 3.5 |
| Apple | 36 | 11.6 g | 4.2 |
| Cooked chickpeas | 28 | 17.7 g | 5.0 |
| Cooked lentils | 32 | 16.2 g | 5.2 |
| Porridge made with rolled oats | 55 | 10.3 g | 5.7 |
| Watermelon | 76 | 8.3 g | 6.3 |
| Cooked pearl barley | 28 | 24.4 g | 6.8 |
| Banana | 51 | 19.7 g | 10.0 |
| Cooked sweet potato | 63 | 16.3 g | 10.3 |
| Boiled potato | 78 | 16.8 g | 13.1 |
| Cooked spaghetti | 49 | 31.4 g | 15.4 |
| Cooked couscous | 65 | 31.0 g | 20.1 |
| Oven-baked fries | 63 | 32.6 g | 20.5 |
| Cooked white rice | 73 | 33.2 g | 24.2 |
| White bread | 75 | 58.3 g | 43.7 |
| Honey | 61 | 82.1 g | 50.1 |
You can see the effect of the portion: watermelon, with a high GI, has a lower load per 100 g than banana, with a low GI, because it is mostly water. Conversely, pasta, with a low GI, has a significant load as soon as you eat a big plateful. For suitable portions, see how much pasta per person and how much rice per person.
What makes the GI of a food vary
The same food does not have a fixed GI. The SFD report, drawing on the work of Jennie Brand-Miller’s team, lists the main factors.
- Starch gelatinisation: the more the starch has swollen during cooking, the faster it is digested. Spaghetti and rolled oats contain little gelatinised starch; sliced white bread and steamed potatoes contain a lot.
- Cooking: according to the SFD, cooking pasta al dente gives it a low GI, whereas prolonged cooking raises it. The French Diabetes Federation gives the same advice for all starchy foods.
- Industrial processes: instant mash (potato flakes) is made by shearing, which fully gelatinises the starch and gives a GI close to glucose. The same goes for snack biscuits puffed by extrusion.
- Seed coats and cell walls: they act as a barrier to digestive enzymes. This is the case for pulses and muesli.
- Particle size: white flours have a higher GI than medium or coarse semolinas.
- The amylose to amylopectin ratio: basmati rice, maize and pulses have a starch richer in amylose, which is digested more slowly.
- Viscous fibres (oats, pulses, apple) slow the digestion of starch. Bran does not have this effect: wholewheat and rye flours are digested quickly.
- Acidity: acids slow gastric emptying. Examples given: vinegar, lemon juice, vinaigrette, marinades and sourdough bread.
- Fats also slow gastric emptying. This is why crisps have a lower GI than boiled potatoes, which obviously does not make them a better choice.
The GI of a complete meal
In real life, you do not eat 50 g of carbohydrate from a single food on an empty stomach. The 2004 Afssa report cites a study by Flint et al. (2004) on 14 breakfasts that all supplied 50 g of carbohydrate but different amounts of fat and protein: the GI of the meal could not be predicted from the GI of its foods. The protein and fat in the meal change the response. In practice, this means two things: combining your starchy foods with vegetables, a source of protein and a little good-quality fat is helpful; and you should not take the figures in the tables as an exact measure of what happens on your plate.
Another lever is regulated: the beta-glucans in oats and barley. The European Union authorises the claim that they help reduce the rise in blood glucose after a meal, provided the meal supplies 4 g of beta-glucans per 30 g of available carbohydrate.
What studies say about the benefit of a low GI
In people with diabetes: a real but modest benefit
The meta-analysis by Chiavaroli et al. (British Medical Journal, 2021), carried out to update the European Association for the Study of Diabetes guidelines, pooled 29 comparisons in 1,617 people with type 1 and type 2 diabetes. Low-GI or low-glycaemic-load diets lowered HbA1c by 0.31 points compared with higher-GI diets, with the certainty of evidence rated as high. They also lowered fasting glucose, LDL cholesterol, triglycerides, weight and systolic blood pressure. The authors describe “small but important” improvements, which add to treatment. For practical application, see our guide type 2 diabetes: diet and prevention.
In the general population: fibre matters more
The major synthesis by Reynolds et al. (The Lancet, 2019) compared several markers of carbohydrate quality. High intakes of fibre and wholegrains are associated with a 15 to 30% reduction in mortality and in several diseases, including type 2 diabetes, with a moderate certainty of evidence. For GI and glycaemic load, the risk reductions are smaller or absent, and the certainty of evidence is rated low to very low. In other words, for a healthy person, eating more fibre is a firmer priority than chasing every GI point. Our guides to dietary fibre and to fibre-rich vegetables will help you get there.
What about satiety?
You often read that a low GI curbs hunger. The SFD is more cautious: studies report contradictory results on the effect of GI on satiety and hunger, in both the short and the long term. If your aim is to eat filling foods, fibre and protein are more reliable levers.
In practice: 8 simple swaps
- Swap instant porridge (79) for plain rolled oats (55), for example in apple and cinnamon overnight oats.
- Swap cornflakes (81) for muesli (57), preferably with no added sugar.
- Swap instant mash (87) for pulses or al dente pasta.
- Replace part of the rice with lentils, as in the lentil and feta salad.
- Add a vinaigrette or a squeeze of lemon to your starchy foods and raw vegetables.
- Eat the fruit rather than the juice: apple 36 versus apple juice 41, and the fruit keeps its fibre.
- Swap puffed rice cakes (87) for a small handful of nuts or a plain yoghurt as a snack.
- Think of barley (28) in salads or risotto, and of the split pea and cumin soup.
All our low-GI recipes are gathered on a dedicated page.
Common myths about the glycaemic index
- “Starchy foods are slow sugars.” False: white bread (75) and boiled potato (78) have a higher GI than white sugar (65).
- “Wholegrain means low GI.” Not necessarily: wholemeal bread 74, brown rice 68. Wholegrain is still richer in fibre.
- “Fructose is ideal since its GI is 15.” Its GI is indeed low (15 ± 4), but the Afssa report notes that a high fructose intake can make lipogenesis, that is, the body’s production of fat, significant. A low GI is not a licence to overindulge.
- “A high-GI food must be banned.” No: watermelon or cooked carrots have a low glycaemic load in a normal portion.
- “Honey is better than sugar.” Their GIs are close (61 and 65). See honey and diabetes.
Precautions
- Treated diabetes: if you take insulin or a treatment that can cause hypoglycaemia, do not abruptly change the make-up of your meals without talking to your care team. The SFD also points out that a high-GI food such as the baguette can be used to correct a hypo.
- Values are averages: they vary with variety, ripeness, cooking and brand. The 2008 tables note that many foods have only been tested once on 10 people or fewer.
- Do not judge a food on its GI alone: also look at its fibre, saturated fat, sugar and energy density.
- “Low GI” products in the shops: read the ingredient list. Some added carbohydrates, such as maltodextrin, are digested quickly.
Frequently asked questions
What is the GI of pasta?
The 2008 international tables give 49 for white spaghetti and 48 for wholewheat spaghetti, which is a low GI. The SFD specifies that cooking al dente keeps the GI low, whereas prolonged cooking raises it.
Should you avoid potatoes?
Their GI is high (78 boiled, 87 as instant mash), but their glycaemic load per 100 g (13.1) is lower than that of white rice (24.2) because they contain less carbohydrate. It all depends on the portion and on what goes with them. See potatoes and diabetes.
What is the difference between GI and glycaemic load?
GI compares equal amounts of carbohydrate (50 g). Glycaemic load takes the real portion into account: GI × carbohydrate in the portion / 100. It is the better reflection of the effect of a plateful.
Do fruits have a high GI?
Most have a low GI according to the tables: apple 36, orange 43, banana 51, mango 51. Watermelon (76) is an exception, with a low glycaemic load per 100 g. For portions, read the least sugary fruits.
Should you eat low GI if you are not diabetic?
You can, but the synthesis by Reynolds et al. shows that fibre and wholegrains have better-demonstrated benefits than a low GI in the general population. The two often go together: pulses, vegetables, whole fruit.
This article is for information only and does not replace the advice of your doctor or a dietitian.
Our sources
- Atkinson FS, Foster-Powell K, Brand-Miller JC. International tables of glycemic index and glycemic load values: 2008. Diabetes Care, 2008;31(12):2281-2283. PMID 18835944.
- Atkinson FS, Brand-Miller JC, Foster-Powell K, Buyken AE, Goletzke J. International tables of glycemic index and glycemic load values 2021: a systematic review. American Journal of Clinical Nutrition, 2021. PMID 34258626.
- Chiavaroli L, Lee D, Ahmed A et al. Effect of low glycaemic index or load dietary patterns on glycaemic control and cardiometabolic risk factors in diabetes: systematic review and meta-analysis of randomised controlled trials. BMJ, 2021. PMID 34348965.
- Reynolds A, Mann J, Cummings J et al. Carbohydrate quality and human health: a series of systematic reviews and meta-analyses. The Lancet, 2019. PMID 30638909.
- Afssa (Anses). Carbohydrates and health: situation report, assessment and recommendations (in French), October 2004.
- Société francophone du diabète (SFD Paramédical) and AFDN. A new look at carbohydrates for diabetes practice (in French), September 2016.
- Fédération française des diabétiques. Nutrition mini-site, Starchy foods sheet (in French).
- European Commission. Regulation (EU) No 432/2012, claim on oat and barley beta-glucans and blood glucose after a meal, 2012.
- Anses. Ciqual food composition table (in French) 2025.
Diabetic? Our guide banana and diabetes gives the glycaemic index by ripeness and the right portion.
Further reading: maltodextrin: real danger or false accusation?, a fast carbohydrate hidden in many products.
Further reading
Food pages: Pasta, Split pea soup, Wholemeal bread, Split peas
Recipes to try: Egyptian koshari, Lentil balls in tomato sauce, Slow-cooked lentils with sausage